Knowing your “best sellers” isn’t as simple as sorting by units. The items that truly power profit—and deserve priority in assortment and purchasing—are the ones that balance demand, margin, velocity, and availability. Below is a practical, non-technical playbook you can run in any spreadsheet or basic BI tool to identify winners, fix underperformers, and buy smarter.
Start by defining “most selling” for your business
Different teams optimize for different outcomes. Pick one primary lens and track the others alongside it:
- Volume — total units sold; great for logistics and vendor negotiations.
- Value — gross revenue; good for revenue planning.
- Profit — contribution margin after product COGS, discounts, shipping, and variable marketing; best for buying decisions. See contribution margin.
- Velocity — units per day (or week); best for forecasting and shelf space.

Simple scorecard idea
Create a Popularity Score = 40% Velocity + 30% Contribution Margin + 20% Revenue + 10% PDP Conversion Rate.
Weights can change, but a blended view prevents one-off promo spikes from dominating.
Minimal data you need
- Orders/line items:
order_date,product_id,variant,quantity,unit_price,discount,refund_flag - Cost & catalog:
cogs,category,brand,launch_date - Traffic & intent (optional but helpful):
pdp_views,add_to_cart,pdp_conversion_rate,search_rank - Inventory:
on_hand_start,received,on_hand_end,stockout_hours
Work at variant level when sizes/colors matter; roll up to product for summary decisions.
The six lenses that reveal true popularity
1) Volume & Velocity (Demand reality check)
- Units sold and units/day (Velocity) over the last 28–90 days.
- For new products, compare D7/D30 velocity to peers launched the same month.
- Seasonality? Compare to same period last year or index to category trend.
Formula: Velocity = Units sold ÷ Days in period.
Use it for: Shelf space, pick/pack planning, and MOQ negotiations. For trend context, explore Google Trends.
2) Value & Profit
- Gross margin % = (Revenue − COGS) ÷ Revenue.
- Contribution = Revenue − (COGS + Discounts + Variable shipping + Performance media tied to the SKU).
- GMROI (gross margin return on inventory) = Gross Margin ÷ Average Inventory Cost. (see GMROI)
Use it for: Buying more of high-margin movers, pruning low-profit space hogs.
3) Availability & “Phantom losers”
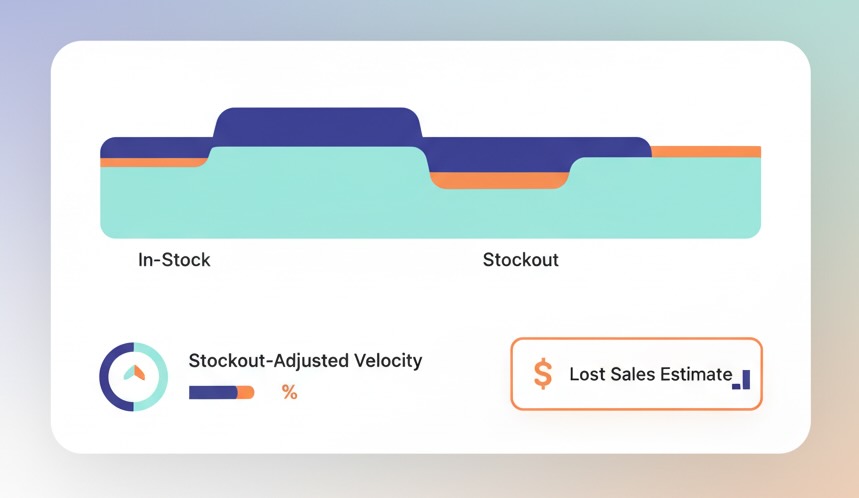
Some products look weak simply because they were out of stock.
- Sell-through % = Units sold ÷ (Beginning inventory + Received).
- Stockout-adjusted velocity: scale velocity by the share of time in stock.
- Lost-sales estimate ≈ In-stock velocity × (Stockout hours ÷ Period hours).
Use it for: Replenishment urgency and vendor conversations. A “loser” with high lost-sales is really a star you starved.
4) Demand vs. Exposure (Fix sleepers and false heroes)
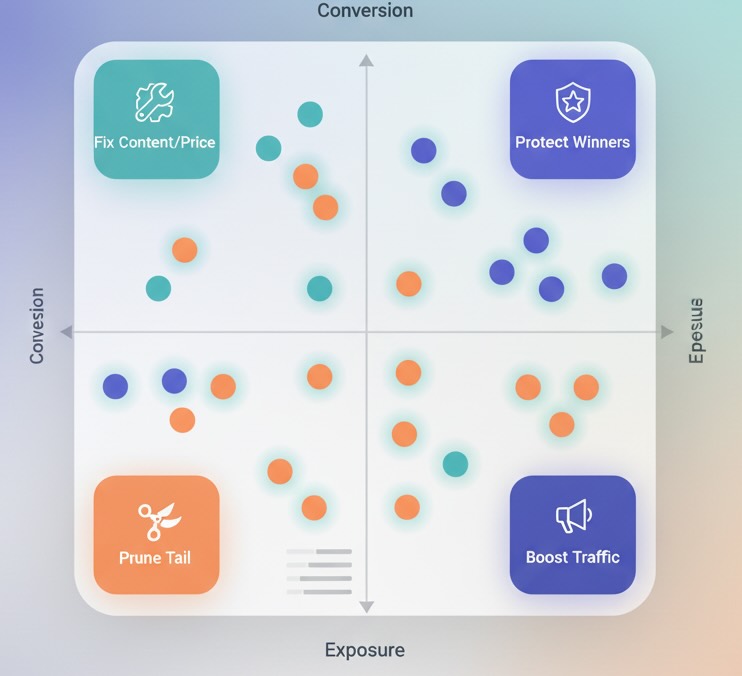
Not all page views are equal. Pair demand with visibility:
- PDP conversion rate = Orders containing the SKU ÷ Unique PDP sessions.
- Revenue per view (RPV) = SKU revenue ÷ PDP views.
Quadrants to act on
- High exposure / low conversion → Content, price, reviews, or fit issue.
- Low exposure / high conversion → Give it more traffic (homepage slot, email, paid).
- High exposure / high conversion → Push harder, protect inventory, raise target ROAS.
- Low exposure / low conversion → Candidate for exit unless strategically important.
5) Price & Discount Sensitivity

- Track units vs. price across normal, promo, and clearance periods.
- If a SKU only moves on discount, label it “promo-dependent”; avoid deep buys or negotiate better cost.
Quick elasticity read: If −10% price reliably yields +20–30% units without crushing margin, moderate promos may be ROI positive; if not, focus elsewhere.
6) Quality Signal (Returns and reviews)
- Return rate by SKU and reason (fit, quality, damage).
- Post-purchase review score and photo review share.
Use it for: Cut rebuys on chronic high-return SKUs—even if units are strong—or invest in size guides and content to reduce returns.
Fast classification methods for assortment and buying
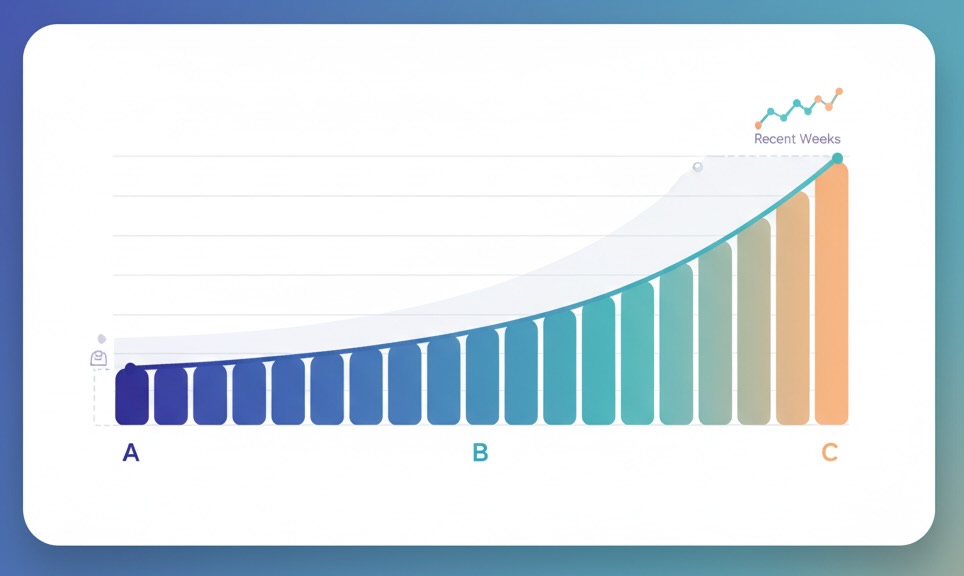
A) ABC by contribution (not just revenue)
- A: Top ~20% of SKUs contributing ~70–80% of profit.
- B: Next ~30% contributing ~15–20%.
- C: The long tail. (Background: ABC analysis.)
Actions
- A: Frequent reorders, higher safety stock, premium placement.
- B: Test content/price to promote to A or streamline variants.
- C: Strict MOQ, seasonal only, or retire; keep if strategic (bundles, LTV).
B) Pareto + Trend filter
Take the 80/20 list, then overlay 4-week trend. A rising B-class item merits trial buys and more exposure; a declining A-class item gets cautious purchasing and a content check.
C) Launch cohort scoreboard
Group SKUs by launch month and compare D7/D30 velocity and RPV to the median of that cohort. You’ll spot early winners (double down) and slow starters (fix content or limit buys).
D) “Basket helpers” (attach-rate)
Some items rarely lead a sale but attach reliably to leaders (batteries, filters, add-ons).
- Attach rate = Orders with accessory ÷ Orders containing the paired parent SKU.
- Keep these in stock with modest safety stock; they lift AOV and take little room.
From analysis to action: simple, reliable plays
Replenishment basics (no heavy math required)
- Reorder point ≈ Average daily sales × Supplier lead time (days) + a safety cushion (e.g., 7–14 days of sales for A items, less for C).
- Review weekly for A items; bi-weekly for B; monthly for C.
Variant rationalization
- If one color/size drives >70% of a SKU’s volume and others rarely convert, trim the tail. Fewer variants improve pick speed and reduce stranded inventory.
Pricing & content hygiene
- For high-view, low-RPV items, check: price position vs. competitors, hero image quality, review count, sizing charts, and shipping/friction. Often a small content update beats a discount.
Promotional guardrails
- Avoid training shoppers to wait for discounts. Use limited bundles or value-adds for A items; reserve deep discounts for end-of-life or C items.
A weekly 30-minute checklist
- Top movers (by velocity and contribution) — any at risk of stockout?
- Hidden winners — strong conversion but low exposure; schedule more slots.
- Suspects — high exposure, poor conversion; assign content/price review.
- Promo dependence — SKUs that only move on discount; reduce buys.
- Returns watchlist — >10–15% return rate with quality/fit reasons; pause reorders.
- New launch pulse — D7/D30 vs. cohort; promote or prune fast.

Common pitfalls to avoid
- Judging during stockouts. Adjust for in-stock time or you’ll under-buy your true heroes.
- Using revenue as the only metric. High ticket items can look great while destroying cash due to returns or slow turns.
- Seasonality blindness. Compare to category trend, not just absolute lines.
- Forgetting bundling effects. Attribute some revenue to accessories that lift AOV even if they rarely lead.
Bottom line
“Best sellers” should mean best for the business, not just biggest piles of shipped units. When you look at products through volume, profit, velocity, exposure, availability, and quality—then act with ABC discipline—you’ll buy the right items, in the right quantities, at the right time. The result is a tighter assortment, fewer stockouts, lower working capital, and a product mix that compounds margin over time.

