
Power BI has shipped a Google Analytics connector for years, so “connect GA4 to Power BI” sounds like a solved problem. It mostly is — until the first refresh comes back with numbers that don’t match what you see in the GA4 interface, or a report that worked in March quietly starts truncating in June.
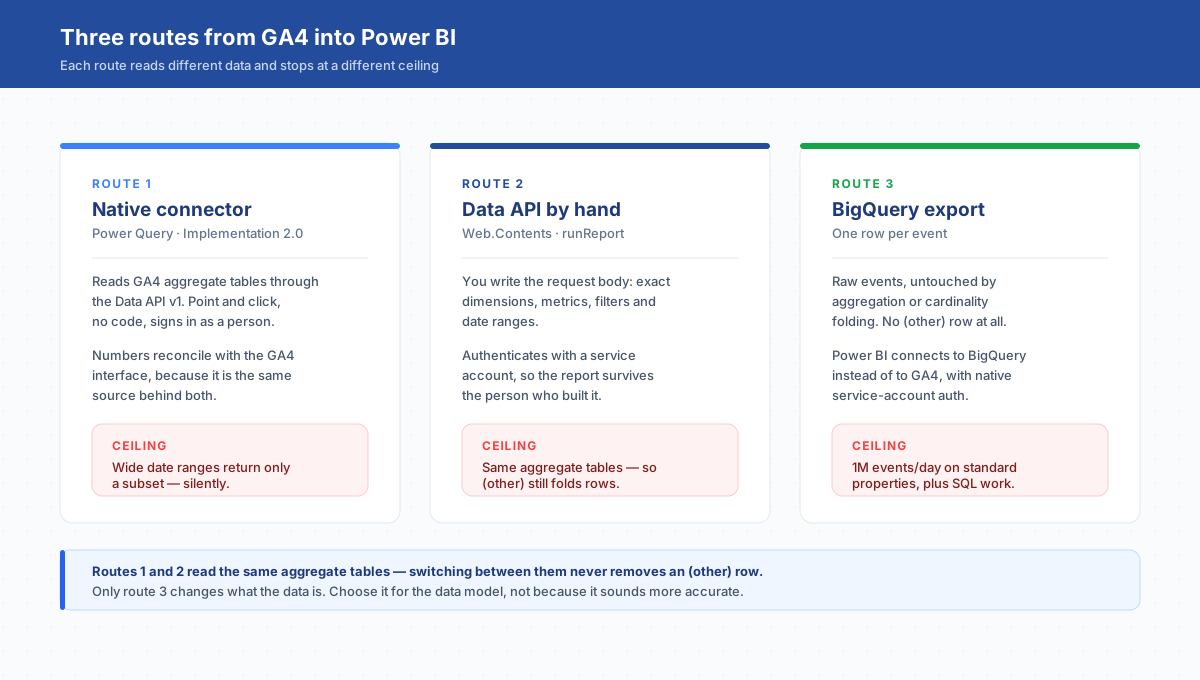
There are three routes into Power BI, and they fail in different places. The native Power Query connector is the fastest to stand up and the first to hit a ceiling. A hand-wired call to the GA4 Data API buys you control over exactly which dimensions and metrics you pull. The BigQuery export is the only path that hands you raw events, and the only one that escapes the aggregation limits baked into the other two.
This guide covers all three, what each costs, and the specific places where your Power BI numbers stop agreeing with GA4.
The native connector runs on the Data API now
Power BI’s Google Analytics connector carries two implementations, and picking the wrong one is the most common opening mistake.
Implementation 1.0 talks to V4 of the Universal Analytics API — the one Google deprecated in July 2023. If your connection string still specifies it, you are pointed at a dead property. Implementation 2.0 uses V1 of the Google Analytics Data API and is the GA4 path. It is now the default setting in the connector.
One detail confuses people in the sign-in dialog: the option still reads “Implementation 2.0 (Beta)” on screen, while Microsoft’s connector documentation lists the connector’s release state as General Availability. The label is stale, not the connector. Pick 2.0.
Authentication is a plain Google account sign-in — no service account, no JSON key file. That is convenient on a laptop and awkward in production, because the refresh runs under whoever authorised it. When that person changes teams, the dataset stops refreshing. If you are building something a department will depend on, authorise it with an account that belongs to the department rather than to a person.
You also need Power BI Desktop from June 2021 or later. Google stopped accepting sign-ins from embedded browser frameworks in July 2021, and older Desktop builds can no longer complete the OAuth flow at all.
The date-range trap that silently trims your data
This is the failure that costs the most trust, because nothing errors out.
Microsoft documents it plainly: when date ranges are very large, Google Analytics returns only a subset of values. Your query succeeds. Your visual renders. The totals are simply lower than they should be, and there is no warning anywhere in the refresh log.
The fix is to stop asking for two years in a single call. Add a date dimension, filter on it, and append several narrower queries instead of one wide one. In the Advanced Editor that means adding ga:date (or the GA4 equivalent) to your dimension list and filtering explicitly:
#"Filtered Rows" = Table.SelectRows(#"Added Items",
    each [Date] >= #date(2026, 1, 1) and [Date] <= #date(2026, 3, 31))
Then repeat per quarter and append. It is uglier than one clean query and it is the difference between a report you can defend and one you can’t.
When you suspect trimming, Power Query’s Query Diagnostics will show you the exact call being sent to Google under the Data Source Query column. Run Diagnose Step with as few transforms as possible stacked on top of the connection — otherwise you can’t tell whether rows vanished at Google’s end or inside your own transform chain.
Quota math, and why Power BI gets more than everyone else
Two separate quota systems apply here, and people routinely blame the wrong one.
Power BI Desktop and the Power BI service get an enhanced allowance for Google Analytics requests: 1,500,000 queries per day and 4,000 queries per 100 seconds. That is generous enough that most teams never touch it.
The limit you will actually hit belongs to GA4 itself. The Data API meters requests in tokens, not calls, and a complex query costs more tokens than a simple one. Google’s Data API quota reference sets these ceilings:
| Quota | Standard property | Analytics 360 |
|---|---|---|
| Core tokens per property per day | 200,000 | 2,000,000 |
| Core tokens per property per hour | 40,000 | 400,000 |
| Core tokens per project per property per hour | 14,000 | 140,000 |
| Concurrent requests per property | 10 | 50 |
| Server errors per project per property per hour | 10 | 50 |
Two things about this table matter more than the numbers. First, every request drains both the hourly property pool and the hourly project pool at once — hitting either one stops you. Second, the quota is per property and shared across everything touching it. Your Power BI refresh, a Looker Studio dashboard someone built last year, and a marketing tool with a GA4 integration all drink from the same 200,000 tokens. A dashboard that dies every morning at 9:15 is usually a scheduling collision, not a broken query.
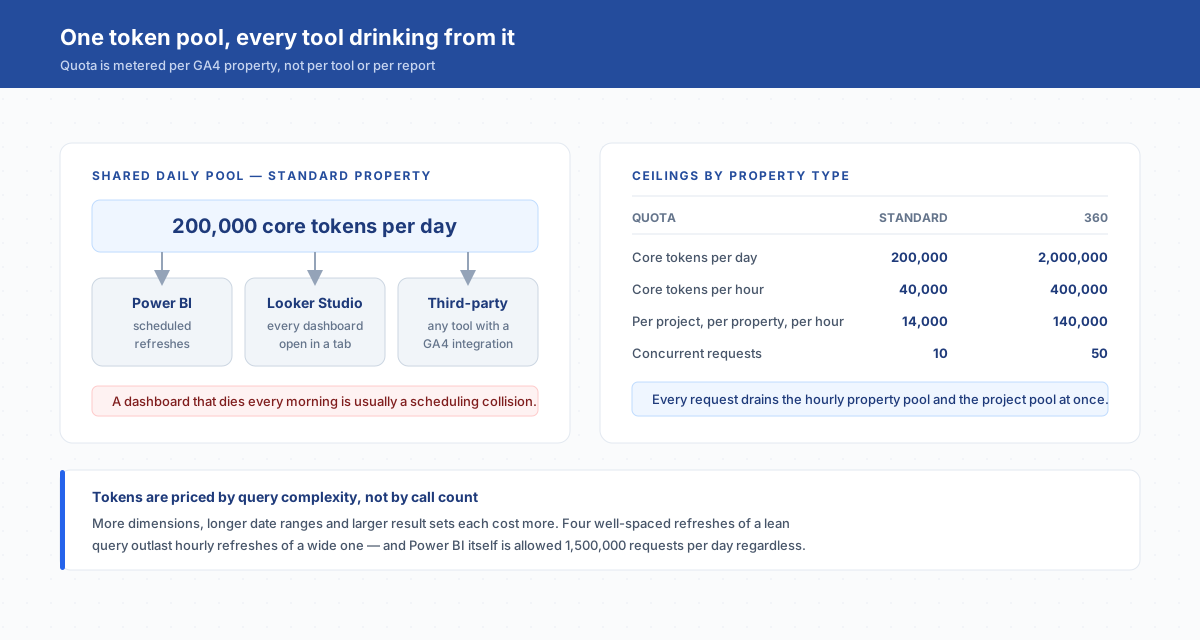
The practical consequence: schedule refreshes deliberately. Four well-spaced refreshes of a query that returns what you need beat hourly refreshes of a query pulling dimensions nobody reads.
Where (other) eats your rows
Cardinality is the reason two people can pull “the same” report and get different totals.
When a table has more distinct dimension values than its row limit allows, GA4 keeps the most common values and folds everything else into a single (other) row. Google’s guidance on high-cardinality dimensions treats any dimension with more than 500 values as high-cardinality, and notes that the row limit varies by report, property type, and query complexity. The one concrete figure Google publishes is the Pages and screens report, whose supporting table has a row limit of 100k.
The part that catches Power BI users: the Data API returns (other) too, because it reads from the same aggregate tables the interface does. Switching from the GA4 UI to the API does not get you out of it. Page paths with query strings, product SKUs, and anything carrying a session or user identifier are the usual culprits — each unique variant burns a row.
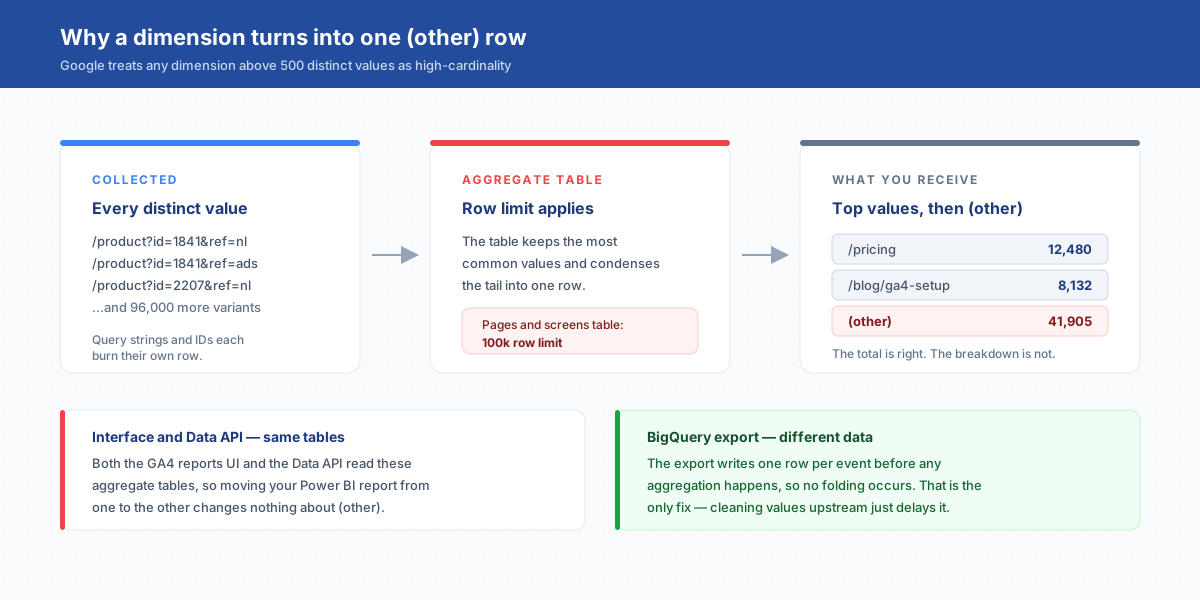
You can reduce the damage by cleaning values before they land (strip query parameters, group SKUs into categories) and by pulling fewer dimensions per query. You cannot eliminate it through the API. Only the raw export does that.
When to wire the Data API by hand
The native connector builds queries for you through a cube interface. That is fine until you need something it won’t express — a specific dimension-metric combination, a custom dimension registered in Admin, or a request shaped to burn fewer tokens.
Calling the Data API directly through Power Query’s Web.Contents gives you the full runReport request body: your own dimension list, metric list, date ranges, and filters. It also moves authentication onto a service account with a JSON key, which fixes the “the report broke when Dana left” problem the native connector creates.
The tradeoff is real work — token refresh handling, pagination, error handling on the 10-concurrent-request ceiling. Reach for this when you have a named limitation the connector can’t clear, not because hand-rolled feels more professional. For most marketing reporting, the native connector plus disciplined scheduling is the right answer.
If your queries lean on custom dimensions, register them properly first — an unregistered event parameter is invisible to both the connector and the API, exactly as it is invisible in the interface. Our guide to creating and naming GA4 custom events covers the registration chain and the 50-dimension ceiling on standard properties.
BigQuery export: the only route to raw events
The export writes one row per event into BigQuery, untouched by aggregation, sampling, or cardinality folding. No (other). No row limits on the underlying table. Power BI then connects to BigQuery instead of to GA4.
The limits move to a different place. Google’s documentation on the BigQuery export caps standard properties at 1 million events per day for the daily export; Analytics 360 supports up to 20 billion events per day. Streaming export carries no volume limit but costs about $0.05 per gigabyte, roughly 600,000 events per gigabyte, on top of BigQuery storage and query charges.
That million-event ceiling deserves attention before you commit. It is not a soft limit that costs extra — exceeding it on a standard property means you need to filter events down to stay inside it, which means deciding in advance which events are worth keeping.
The other cost is skill. BigQuery hands you a nested event schema, and reconstructing a session or attributing a conversion in SQL is meaningfully harder than dragging a metric into a cube. Teams that adopt the export because they were told it’s “more accurate” and then rebuild GA4’s session logic badly end up with numbers that are precisely wrong instead of approximately right.
Which route fits which property
| Situation | Route | Why |
|---|---|---|
| Standard marketing dashboard, a handful of dimensions | Native connector | Fastest to build, quota is not a constraint at this size |
| Numbers must reconcile with GA4 reports exactly | Native connector or Data API | Both read the same aggregate tables — the interface will agree with them |
| High-cardinality dimensions (page paths, SKUs, IDs) | BigQuery export | Only route without (other) folding |
| Service-account auth required for governance | Data API or BigQuery | Native connector authenticates as a person |
| Over ~1M events/day on a standard property | Native connector or Data API | Daily export cap makes BigQuery awkward without filtering |
| Custom event-level analysis, funnels rebuilt in SQL | BigQuery export | Aggregate APIs can’t express it |
Checking whether the numbers are right
Assume disagreement until you’ve proven otherwise, and check in this order.
Start by narrowing to a single day and one metric — sessions or total users — and compare Power BI against the GA4 interface for that day. A same-day match with a whole-period mismatch points straight at the date-range trimming described above.
Next, look for an (other) row in your result set. Its presence tells you the dimension exceeded the table’s row limit and your per-value breakdown is incomplete, even though the total is right.
Then check timing. GA4 data continues to be processed after collection, and a refresh that runs at 06:00 for “yesterday” can catch an incomplete day. Pulling data with a two-day lag removes an entire category of phantom discrepancies.
Finally, confirm what was actually requested. Query Diagnostics shows the emitted API call; comparing it against what you believe you asked for settles most arguments in one look.
One structural warning: don’t reconcile a Power BI report against a BigQuery query and expect equality. They are different datasets. GA4’s reporting tables apply modeling and thresholding that raw events don’t, and the gap between them is expected behaviour, not a bug in either.
Frequently asked questions
Does Power BI have an official GA4 connector?
Yes. The Google Analytics connector in Power Query supports GA4 through the Google Analytics Data API v1 using the Implementation 2.0 setting, which is the default. Implementation 1.0 targets the deprecated Universal Analytics API and should not be used for new work.
Why don’t my Power BI numbers match GA4?
Three common causes, in order of frequency: a wide date range where GA4 returned only a subset of rows, an (other) row folding high-cardinality values, and a refresh that ran before GA4 finished processing the day. Compare a single completed day first to isolate which one you have.
Do I need BigQuery to use GA4 with Power BI?
No. The native connector and the Data API both work without it. You need BigQuery when high-cardinality dimensions are being folded into (other), when you want event-level detail, or when governance requires service-account authentication and full data ownership.
How many GA4 API tokens does a Power BI refresh consume?
It depends on query complexity rather than the number of calls — more dimensions, longer date ranges, and larger result sets cost more tokens. A standard property gets 200,000 core tokens per day, shared across every tool querying that property, so budget for Looker Studio and any third-party integrations drinking from the same pool.
Can I use a service account instead of my personal Google login?
Not with the native connector, which authenticates as a Google user. Service-account authentication requires either calling the Data API directly through Web.Contents or routing through the BigQuery export, where Power BI’s BigQuery connector handles it natively.
What to do next
Build the first version with the native connector on Implementation 2.0, filter to a date range you can verify by hand, and reconcile a single day against the GA4 interface before anyone else sees the report. If that day matches and your period doesn’t, you have a range problem. If a dimension shows (other), you have a cardinality problem, and the export is the only real fix.
Reporting quality starts upstream of the connector. If the events feeding GA4 are inconsistently named or unregistered, no BI tool will rescue them — our GA4 tracking QA checklist is the pre-flight worth running before you wire any dashboard to a property.